
Mary Dolittle’s down payment didn’t begin as money. It began as years, nearly a decade of them, passing quietly enough that nobody would have thought to photograph the process.
After college, she moved in with her parents in Marco Island, built a career in public relations, paid off her student loans and her car, maintained a credit score around 800, and saved. By 31, she had accumulated enough to put 25% down on a roughly $400,000 condominium in Naples, Florida. There would eventually be paperwork, a mortgage, and a number on a settlement statement, but none of those documents would contain the most expensive part of the story:
How long it took to make that number possible.
The usual word for those years is discipline. It fits, although it leaves out something economically important. Every month Dolittle remained with her parents was a month in which a larger share of her earnings could become savings rather than rent. Someone arriving with substantial capital might have reached the same closing table sooner, while someone buying with a partner could have divided the burden between two incomes. Dolittle had neither advantage, so the calendar became part of her financing.
Housing statistics are remarkably good at seeing what happened next. They can tell us a buyer’s age, income, purchase price, down payment, marital status, and mortgage rate. They’re considerably worse at seeing the financial biography that produced those numbers: the student loan that disappeared three years earlier, the vacation that wasn’t booked, the extra year spent at home, or the rent that one buyer kept paying while another was able to save.
That missing interval matters when we discuss single women buying homes. The story is usually presented as evidence of financial independence, and much of it is. But the visible act of buying can conceal a long period during which that independence was being financed one month at a time, often with no transaction, application, or public record to announce that anything interesting was happening.
Dolittle eventually found a joke for her situation. It was just her and the mortgage, which meant no second person on the loan, no second income behind the payment, and nobody automatically responsible for half the cost when something broke. What looked at closing like one decisive financial act had actually been under construction for years.
The Numbers Don’t Tell the Whole Story
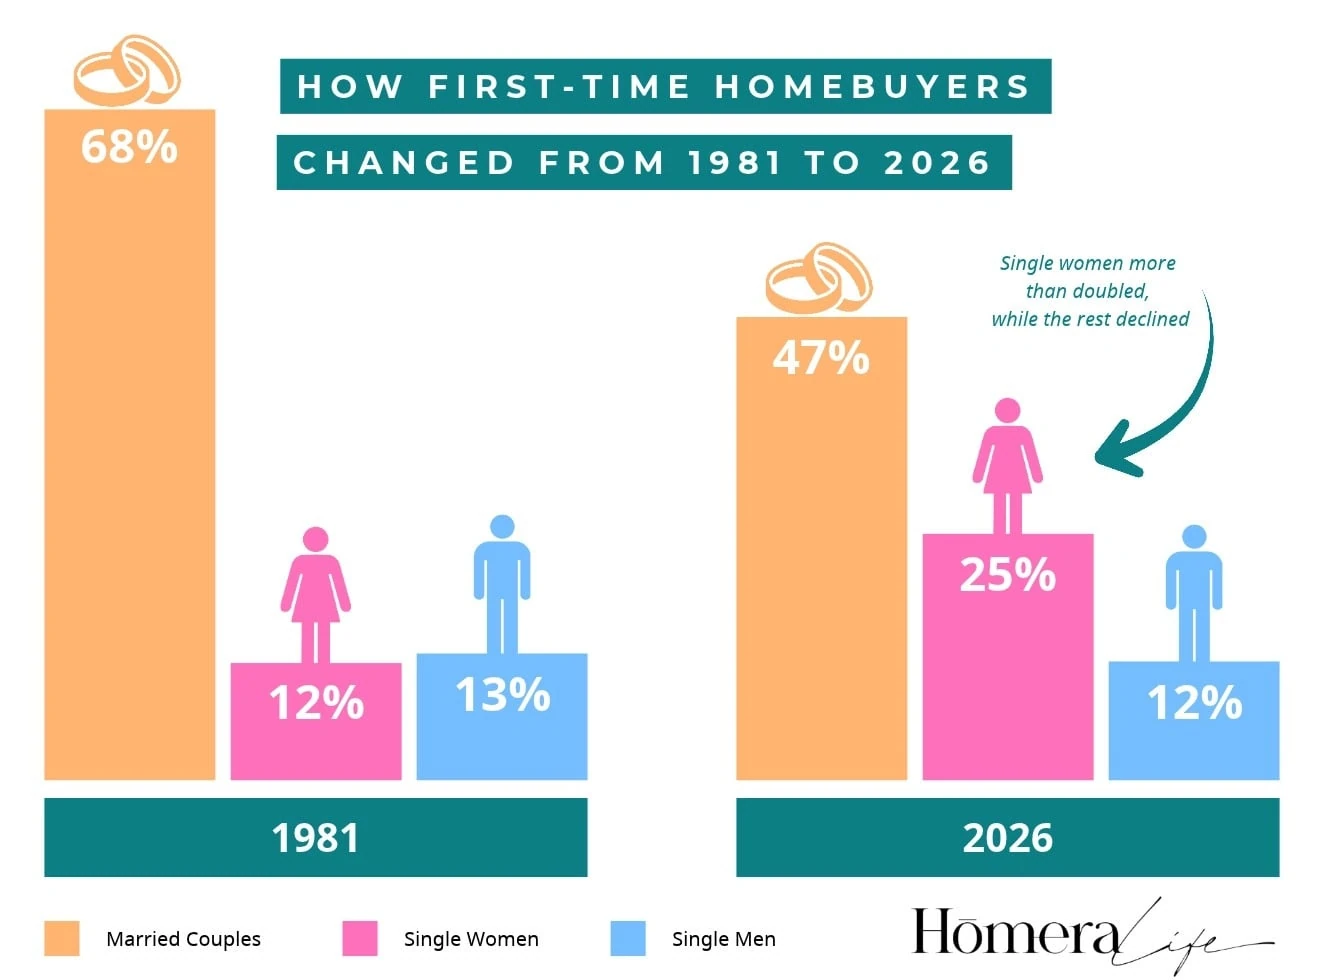
When the National Association of Realtors began tracking first-time home buyers in 1981, married couples represented 68% of purchases. Single women accounted for 12%, slightly behind single men at 13%. Forty-five years later, that relationship has reversed.
NAR’s 2026 Profile of Home Buyers and Sellers, released November 5 and covering transactions from July 2025 through June 2026, found that among first-time buyers, 47% were married couples, 25% were single women, and 12% were single men. Another 11% were unmarried couples, and 5% purchased with roommates.
Those numbers come with an important warning because the survey begins with people who succeeded. According to NAR’s published 2026 methodology, the organization sent a 121- question survey to 228,250 recent buyers in July 2026 and received 7,125 responses from people who had purchased primary residences. The adjusted response rate was 3.1%, and NAR reports a margin of error of plus or minus 1.16 percentage points at the 95% confidence level for the overall sample. That national margin shouldn’t be assumed to apply unchanged to smaller subgroups inside the survey.
NAR is also a trade association representing real estate professionals, which is worth remembering whenever its research is used to describe the market. More important for this story, its Profile doesn’t contain the people who saved for four years and stopped, failed to qualify for a loan, lost three bidding wars, or opened a mortgage calculator one evening and decided renewing the lease suddenly looked rather sensible.
For years, income seemed to offer one explanation for the difference between single women and men. Women were purchasing more frequently even though the men reaching the market tended to earn more. It made for an irresistible story: women wanted ownership badly enough to overcome an income disadvantage.
The numbers no longer cooperate with that explanation. For more than one recent reporting cycle, first-time single women have reported higher median household income than comparable single men. The recent NAR comparison puts women at roughly $73,000 and men at about $66,400, which means the familiar story of women buying despite earning less no longer describes the people actually reaching the closing table.
The more interesting question moves backward. The income figure tells us where someone ended up, but not how quickly that person was closing the distance between wanting a home and being able to afford one. Two buyers can arrive at roughly the same salary while having taken very different routes to get there.
The Hidden Years Behind a Down Payment
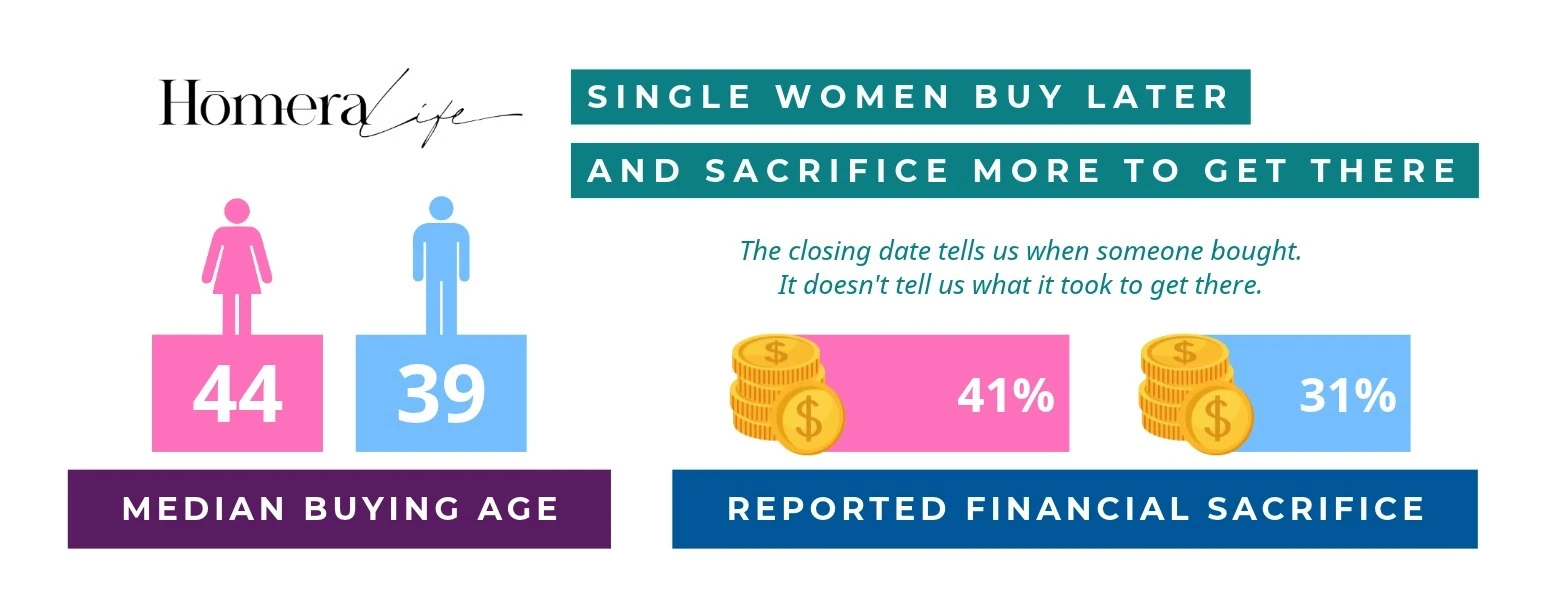
One clue is sacrifice. NAR has found that 41% of single female buyers reported making financial sacrifices to purchase, compared with 31% of single male buyers. Another clue is age. The median first-time single female buyer is about 44, compared with 39 for a single man.
Five birthdays separate those medians, but the statistics don’t tell us what happened between them. A birthday is easy to record. The financial work performed between birthdays is considerably harder.
Realtor.com tried to measure one part of that waiting period in December 2025. Using median household income, typical down payments, and the national personal savings rate, its economists estimated that a median-income household would need about seven years to accumulate a typical down payment. In the country’s most expensive markets, the calculation became almost absurd, rising above 36 years in San Francisco and San Jose to roughly 34 in Los Angeles, 30 in San Diego, and more than 23 in New York.
Nobody should mistake those figures for predictions about an actual household. Incomes rise, people move, savings rates change, and relatives sometimes help. But the exercise exposes something that disappears when affordability is reduced to a monthly mortgage payment: saving for the right to begin paying a mortgage can consume a meaningful portion of adult life.
That’s what makes Dolittle’s decade with her parents more than a biographical detail. She did the saving herself, but she possessed something economically valuable that would never appear as an asset on a mortgage application: somewhere relatively inexpensive to wait. Although the bank account eventually does, no one sends a monthly statement showing the value of that arrangement.
Why Two People With the Same Income Don’t Have the Same Advantage
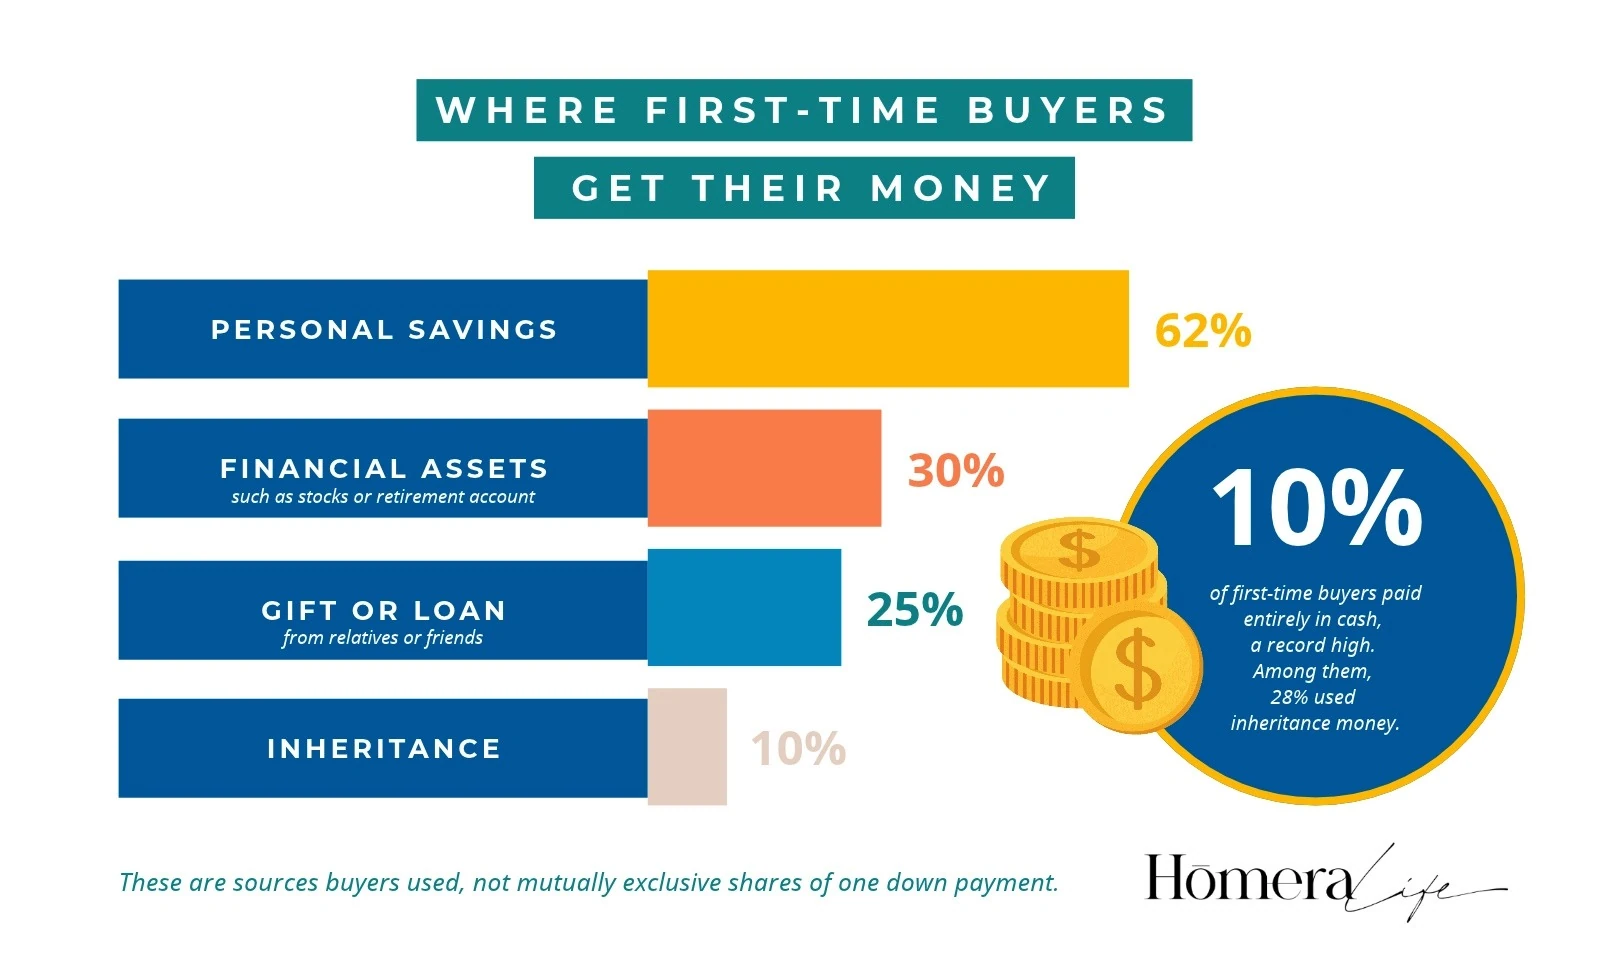
The latest NAR data suggest that this kind of runway has become increasingly important. In 1993, 12% of first-time buyers had been living with relatives before purchasing. By 2026, that figure had climbed to 21%. Personal savings remained the leading source of down-payment money, used by 62% of first-time buyers, so this isn’t a story in which inheritance has replaced thrift. But 30% also drew on financial assets, 25% used gifts or loans from relatives or friends, and 10% used inheritance. A record 10% of first-time buyers purchased entirely with cash.
The difference often appears near the margin. Imagine two people earning the same salary, each with $40,000 saved today. One can continue living with their parents for another year, while the other must pay $2,000 a month in rent. Over the next twelve months, that's $24,000 in housing expenses one person may be able to avoid. They start in the same financial position, but their financial trajectories are very different.
For the renter, the useful question isn’t simply how much money has already been saved. It’s whether the gap is actually closing. If another year adds $12,000 to the account, waiting is doing meaningful financial work. If another year adds $1,200 while prices, insurance, and ownership costs continue moving, the calendar may be passing faster than the buyer is gaining ground.
Family money can change the same equation overnight. A $25,000 gift might represent several years of saving delivered in an afternoon. What appears on the settlement statement as cash can therefore contain something the document never shows: months or years the recipient didn’t have to spend producing it.
The Missing Data Behind Women’s Homeownership
This relationship between time and capital is easy enough to establish. People without sufficient capital can accumulate it over time, while existing wealth can shorten the time required. What we can’t establish nearly as confidently is the gendered version of the story, whether single women systematically spend more years accumulating what comparable single men obtain through some other route.
The reason we can’t answer that question cleanly is revealing. There’s no major national dataset that starts when otherwise comparable single women and men begin seriously saving for a first home, records their rent, debt, income, starting wealth and family assistance, and then follows them until they buy or abandon the attempt.
Researchers have come closer. In the 2017 Fannie Mae working paper The Shifting Determinants of Young-Adult Homeownership Before and After the Great Recession, Dowell Myers, Gary Painter, Julie Zissimopoulos, Hyojung Lee, and Johanna Thunell used longitudinal Panel Study of Income Dynamics data from 1999 through 2013 to examine adults ages 25 to 34. Their models incorporated income, wealth, parental socioeconomic resources, marital status, children, and local housing conditions, showing just how entangled the path to ownership is with both personal and family resources.
Even that unusually rich dataset doesn’t start a clock when a single person begins saving and stop it when she buys. That absence is revealing because waiting is not the sort of thing the housing system naturally records. A mortgage creates an application, a purchase creates a deed, and a sale creates a price. Staying with parents another year creates no document, while canceling a vacation because the down payment is still $8,000 short leaves behind nothing more dramatic than an unused suitcase.
This may be one reason the empowerment story is so appealing. We can see the woman who reaches closing. We have much less systematic information about what she spent getting there, particularly when what she spent wasn’t a check but time.

That doesn’t give us permission to turn missing information into a convenient conclusion. The fact that successful single women arrive later and report more financial sacrifice doesn’t prove that women systematically exchange more time for homeownership. The difference could also reflect earnings trajectories, debt, geography, career mobility, family formation, or differences in the kinds of properties men and women want.
What the evidence does support is narrower and more interesting. Time has become economically important to entering American homeownership. Women who successfully buy alone tend to arrive later and report more sacrifice than comparable men, yet the datasets normally used to explain homeownership tell us surprisingly little about the years connecting those facts.
There’s a male mystery on the other side of the same filter. If single women make up 25% of first-time buyers and single men only 12%, what happened to the men who might otherwise have purchased? Some may rent longer, remain with family, value mobility more highly, or put their money elsewhere. Others may simply care less about owning at a particular stage of life. Existing buyer surveys are much better at identifying the men who arrive than explaining the men who disappear somewhere along the way.
Why Two People With the Same Income Don’t Have the Same Advantage
A different measurement problem appears when we move from people buying now to people who already own.
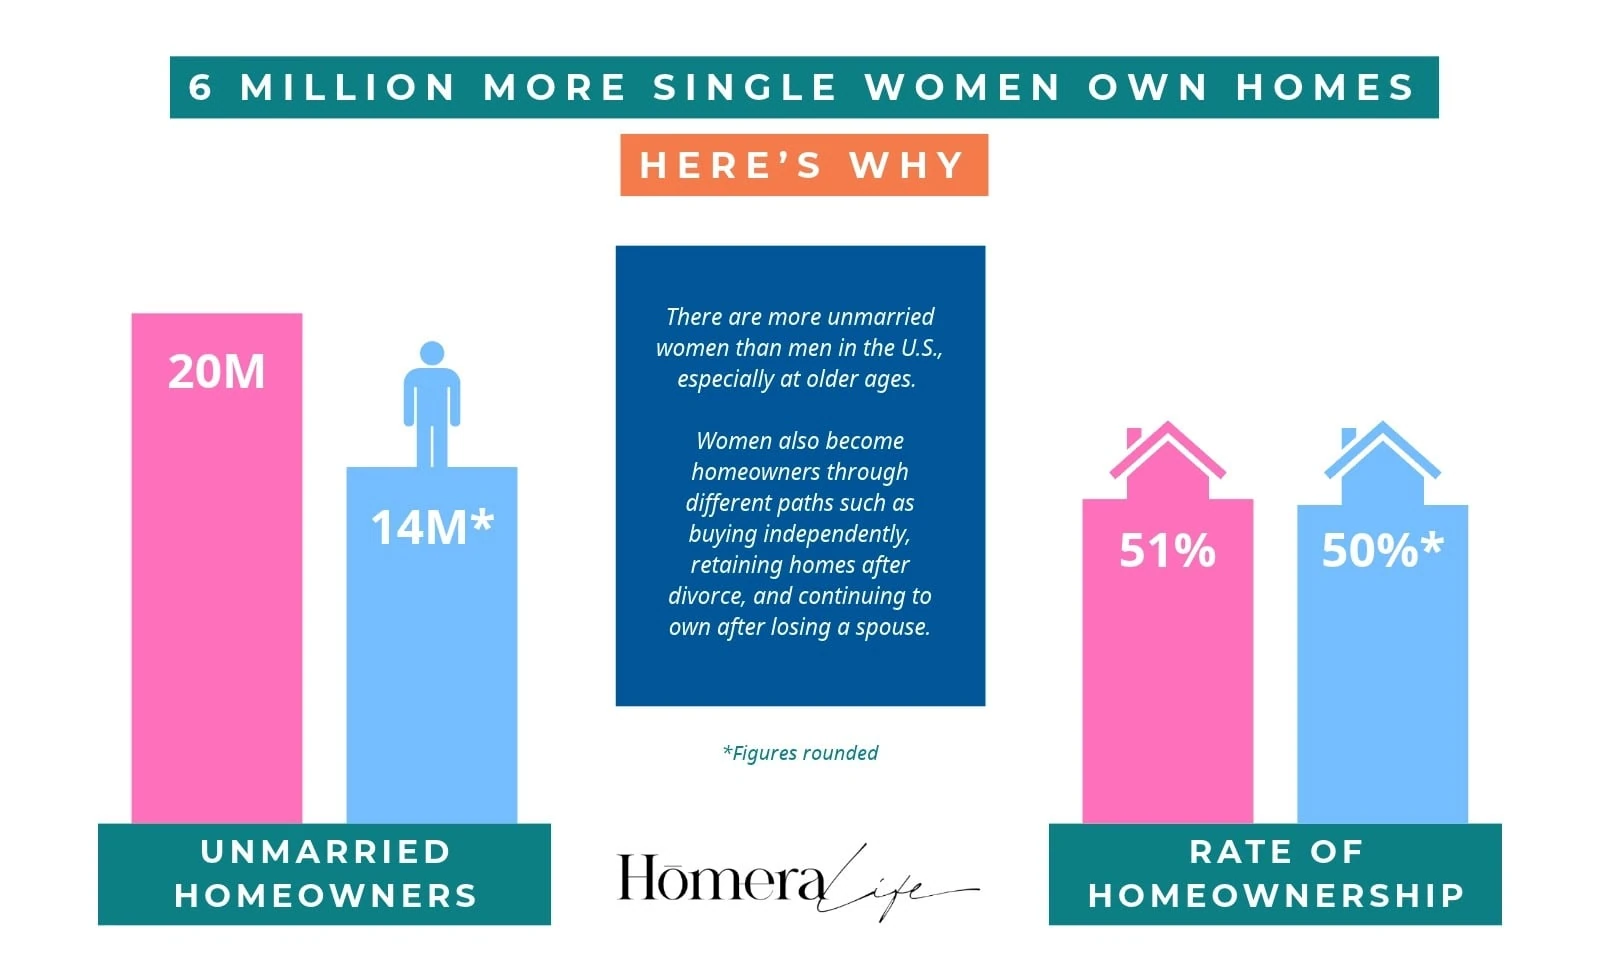
More than 20 million unmarried women own homes in the United States, compared with roughly 14 million unmarried men. That sounds like a dramatic female advantage until the ownership rates are examined. NAR’s 2026 analysis of American Community Survey data puts the rate for single women at about 51%, compared with just under 50% for single men. The count gap is enormous, while the rate gap is barely there.
Pew Research Center reached a similar conclusion in Richard Fry’s 2023 analysis, Single women own more homes than single men in the U.S., but that edge is narrowing. Pew found that single women owned 58% of homes owned by unmarried Americans in 2022, but much of the numerical advantage resulted from there simply being more single women, particularly at older ages.
Imagine a married couple who bought a house in 1995. Thirty years later the husband dies. Nobody buys another house, no lender approves another mortgage, and no real estate agent gets another closing photo. Yet a property that yesterday belonged statistically to a married household can now appear in the single-woman column.
That’s why the stock of people who already own homes and the flow of people buying them now tell different stories. One reflects decades of marriages, divorces, deaths, and accumulated equity. The other reflects today’s prices, rates, and barriers to entry.
Younger women are moving too, which means widowhood can’t explain everything. NAR’s Census-based analysis shows homeownership rising over the decade through 2024 among women ages 25 to 34 and 35 to 44, as well as among never-married, divorced, and separated women. Gen Z still represents only a small portion of all buyers, but single women account for an unusually large share of the young adults who have managed to purchase.
Once again, the interesting number isn’t simply where somebody stands today. It’s whether the distance to ownership is shrinking quickly enough for that person ever to arrive.
Buying a Home Alone Is Only Half the Financial Challenge
Mortgage rates have made the calculation harsher. Freddie Mac’s average 30-year fixed rate stood at 7.18% on November 5, 2026. If you take out a $320,000 30-year mortgage at 3%, your monthly principal and interest payments will be about $1,349. At 7.18%, the same debt costs about $2,168, roughly $819 more every month before property taxes, insurance, association fees, maintenance, or repairs.
For someone buying alone, affordability therefore has two parts. The first is accumulating enough capital to buy. The second is preserving enough financial room afterward to withstand ownership.
Dolittle was worried about the second question before she had completely solved the first. She wanted a substantial emergency reserve after making the down payment because the amount required to acquire a condominium wasn’t the same as the amount required to own one safely. There was no second paycheck waiting if an assessment arrived, an insurance bill jumped, or her employment changed.
The same question about whether the gap is closing continues after the purchase. Before buying, the gap is between today’s savings and the required down payment. After buying, it’s between the household’s reserves and whatever expensive surprise eventually arrives. A person can pass the lender’s affordability test and still discover that her financial margin is shrinking rather than expanding.
That longer journey carries a cost. In its November 2026 discussion of the historically high age of first-time buyers, NAR estimated that delaying homeownership by a decade could mean roughly $150,000 less in accumulated housing equity. The figure depends on assumptions about appreciation and shouldn’t be treated as a guaranteed loss, but the mechanism is straightforward: somebody who enters ownership later has fewer years in which mortgage principal can decline and property values can potentially compound.
There may then be another cost after ownership begins. Paul Goldsmith-Pinkham and Kelly Shue examined well over 50 million U.S. housing transactions from 1991 through 2017 in research published in The Journal of Finance. Among transactions in which they could identify gender and calculate realized returns, single women earned lower annualized unlevered housing returns than single men. Roughly 45% of the raw difference was associated with where and when the transactions occurred, while a smaller difference remained even after close comparisons of location and timing.
Their research indicates that women earn similar returns regardless of when they enter homeownership, and those mechanisms should remain distinct. Delayed entry can mean fewer years available for housing wealth to accumulate. Goldsmith-Pinkham and Shue show that, historically, single women also earned somewhat lower returns during the years they owned.
Together, those findings make the five-year difference between first-time single female and male buyers more consequential without pretending that we know what causes it. They also complicate what we mean when we call the woman buying alone independent.

A woman who buys alone controls the asset. Every dollar of principal she repays increases her equity, and if the property appreciates, the gain belongs to her. But the property tax, insurance increase, repair, special assessment and interruption in income belong to her too. None of them care whether the closing photograph looked triumphant.
That photograph is still the moment our housing system understands best. We know who arrived, what the home cost and how the purchase was financed. What remains much harder to see is the ordinary financial life that made arrival possible.
Mary Dolittle spent nearly ten years in that ordinary part of the story. There was no public record when she paid off the car, no housing statistic when another month’s savings landed in her account and no transaction to record when staying with her parents shortened the distance between her salary and a condominium in Naples.
For years, almost nothing happened that the housing market knew how to count. She went to work, paid what she owed, and kept narrowing the gap between what she had and what she needed. Eventually, the distance became small enough for the housing market to notice.
By then, most of the story had already happened.